Select Page
Poker Forum
Over 1,291,000 Posts!
Poker ForumShort-Handed NL Hold'em

Some EV graphs

Results 1 to 14 of 14
  1. #1

    Default Some EV graphs

    I took a break from pokers because I was playing like a moron, just back a couple of days, and I decided to take a look at my new database using that ev program. Previously I found I was a big loser in pots that didn’t go to showdown and it’s something I’m working on.

    Anyway, I noticed there was an option to filter the hands, and played around with the that for a while and found the resulting graphs somewhat interesting…

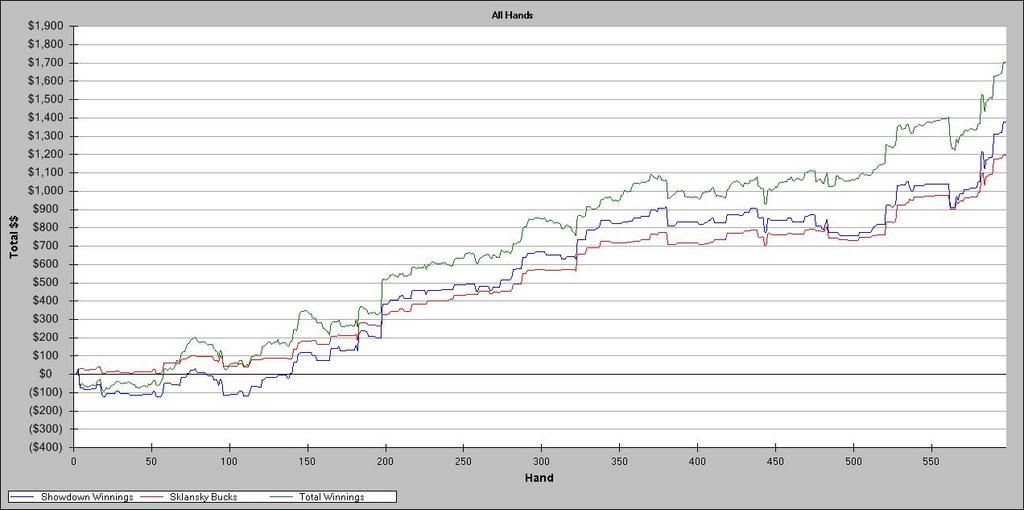
    My last 3days at 100nl, a bit meh:


    High Card:


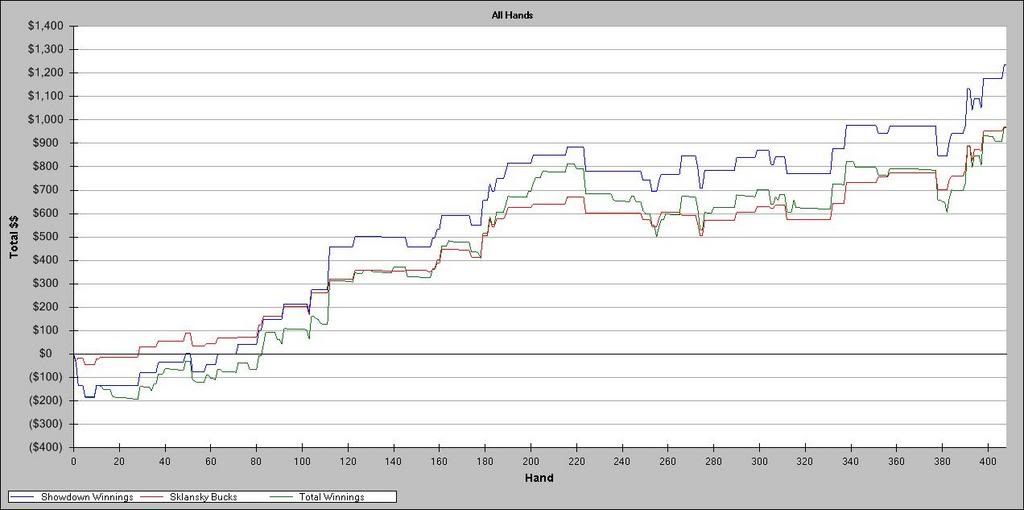
    1 pair


    2pair


    better than high card


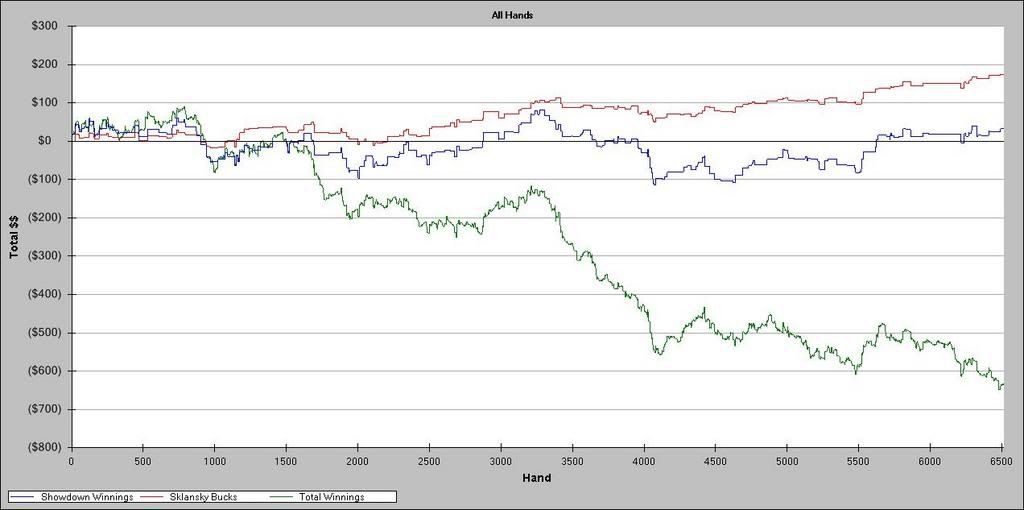
    pots greater than 30bbs


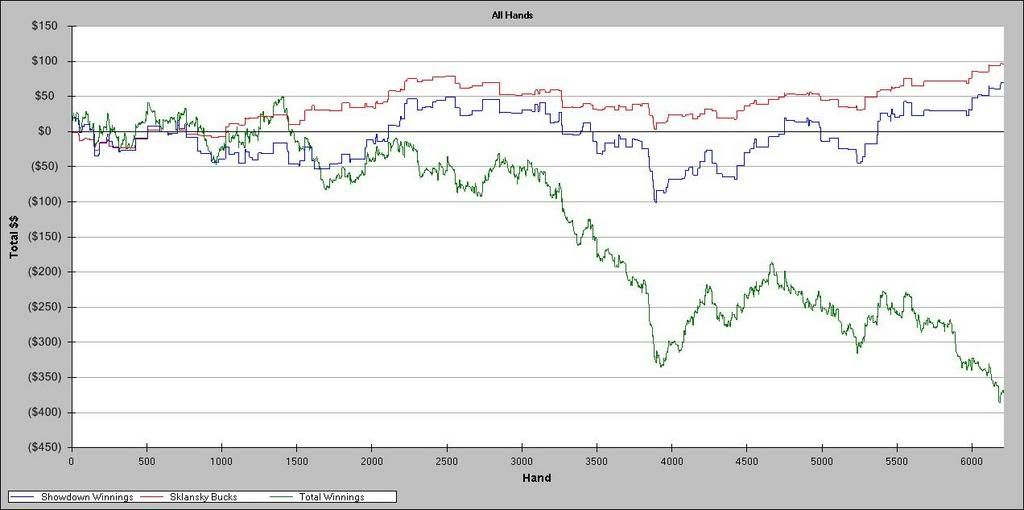
    Smaller than 30bbs


    Smaller than 20bbs


    Plus these are my stats:


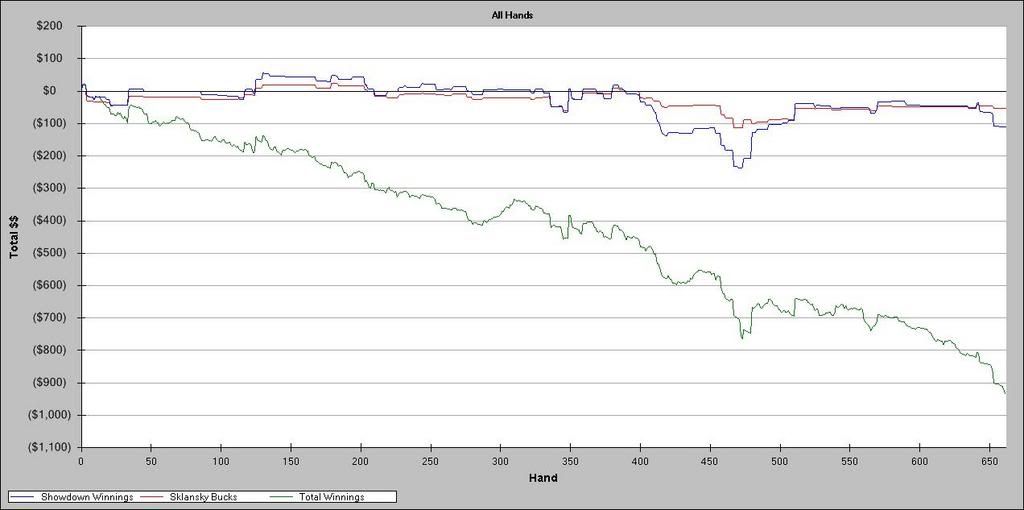
    Just wondering what these graphs are like for other people? Although it's a small sample I clearly suck at pots <30bbs.

    Is there anything glaring wrong with my stats? or any general advice to help? looks like a pretty big leak I've to plug.
  2. #2
    I don't understand how this can calculate sklansky bux in non shoudown pots?
  3. #3
    Miffed22001's Avatar
    Join Date
    Jun 2005
    Posts
    10,437
    Location
    Marry Me Cheryl!!!
    is there no master sticky for this thing?

    looks like you run bad or play bad small ball.
  4. #4
    Quote Originally Posted by Miffed22001
    is there no master sticky for this thing?

    looks like you run bad or play bad small ball.
    He's not running bad unless he is getting coolered a lot. Blue line is above red line...
  5. #5
    Quote Originally Posted by Irisheyes
    I don't understand how this can calculate sklansky bux in non shoudown pots?
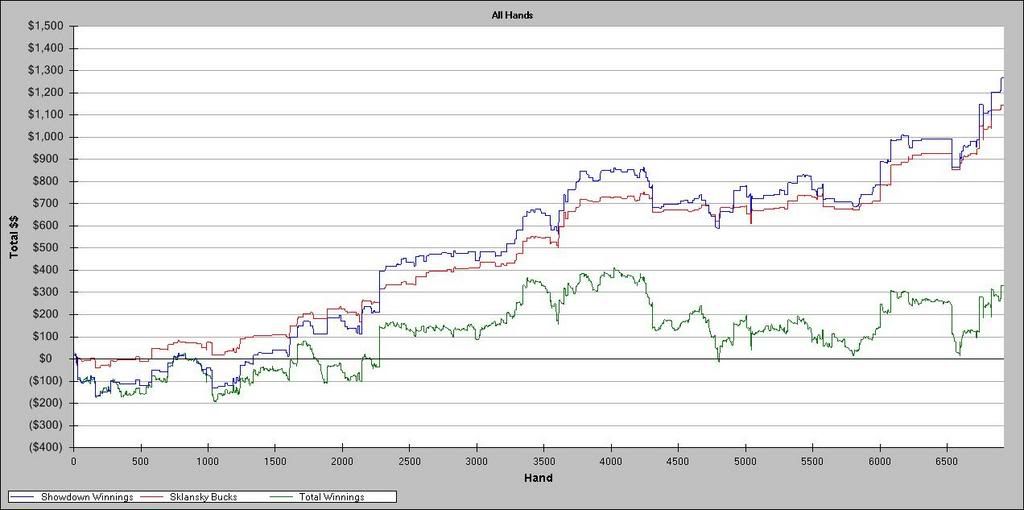
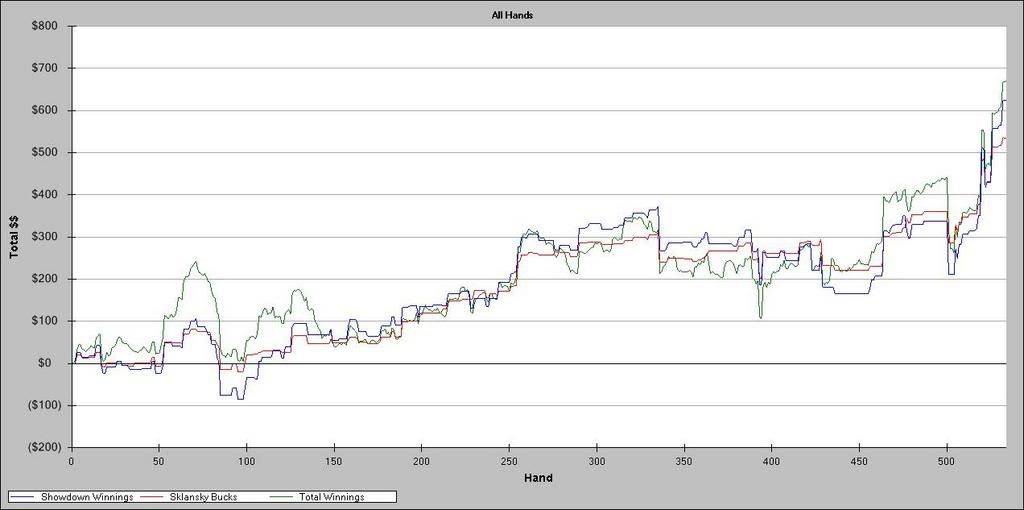
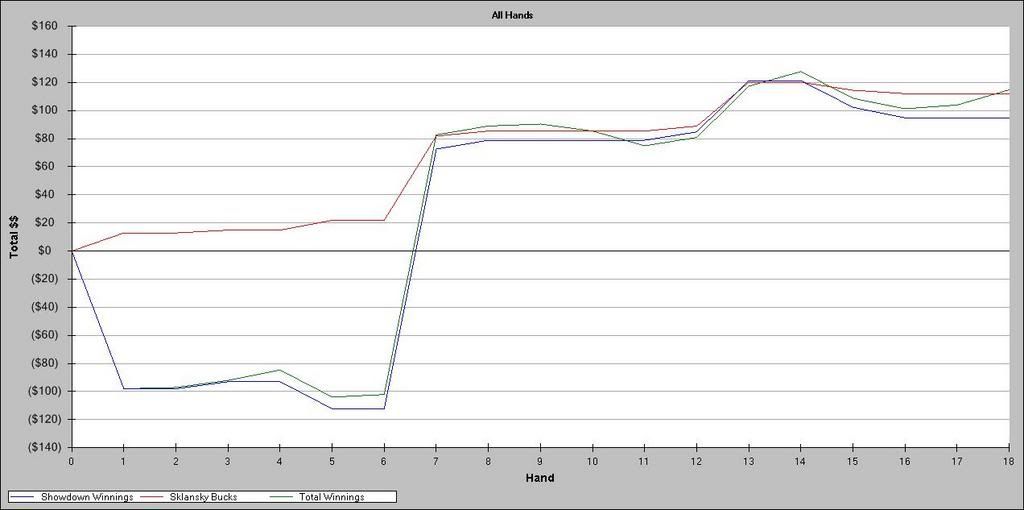
    it doesn't. the red is the sklanky bucks in pots that go to showndown, blue is actual winnings on those pots, and green is all pots.
  6. #6
    So like if you raise and cbet a flop and get called then check it down to showdown, at what point of the hand is your sklansky bux calculated? The preflop bet and flop bet?

    So from the graphs it looks like you suck at cbetting right?
  7. #7
    Quote Originally Posted by Irisheyes
    So like if you raise and cbet a flop and get called then check it down to showdown, at what point of the hand is your sklansky bux calculated? The preflop bet and flop bet?

    So from the graphs it looks like you suck at cbetting right?
    It's calculated street by street for every bet.

    i dunno. possibly.
  8. #8
    photobucket keeps logging me out everytime i try to upload pic

    anyway:

    Hands i raised pf


    Raise pf+bet flop


    Raise pf+bet flop pot<30bbs

  9. #9
    I dunno I don't get it.
  10. #10
    Quote Originally Posted by Irisheyes
    I dunno I don't get it.
    Total winnings are for all the hands, Sklansky bucks and showdown winnings are for hands that went to showdown. Op is either spewing on hands that don't go to showdown or getting coolered a lot.

    That said, most tags seem to have the green line below the other lines because they often fold the best hand.
  11. #11
    Miffed22001's Avatar
    Join Date
    Jun 2005
    Posts
    10,437
    Location
    Marry Me Cheryl!!!
    Quote Originally Posted by badgers
    Quote Originally Posted by Irisheyes
    I dunno I don't get it.
    Total winnings are for all the hands, Sklansky bucks and showdown winnings are for hands that went to showdown. Op is either spewing on hands that don't go to showdown or getting coolered a lot.

    That said, most tags seem to have the green line below the other lines because they often fold the best hand.
    if the green is much lower than the other two does this mean TAGGy players are being bought off too many pots?

    My latest graphs show the green line much closer to the other two with are pretty close anyhow?

    is there a thread somewhere explaining how to use because the one on 2+2 gave me nothing
  12. #12
    Yeah most of what I'm saying is just stuff I've picked up from browsing and worked out, I haven't seen any explanation threads anywhere.

    If the green line is below the others, you are losing a lot of pots that have not gone to showdown, be that through cbets getting raised, bet flop/turn/ river whatever and getting raised/ bet on later streets. I think it's pretty normal to have the green line below the others if you have a high win at showdown % because you will make most of your money in pots that go to showdown.

    I guess if your green line is closer you could be being less aggro when you don't have a hand ie. lower cbet % etc, or you are running goot, or your win showdown % is going down.

    I don't think I've ever seen a good player say that they have a lot of belief that you can get good analysis of your game from these graphs though. Maybe if you couple the graphs with PT stats you can get something, but I think the main use is to see how well you're running and it's debatable that it even shows that...
  13. #13
    Chopper's Avatar
    Join Date
    Dec 2005
    Posts
    4,611
    Location
    St. Louis, MO
    post this in beginner forum, and freak them out.

    seriously, try NL Strategies.
    LHE is a game where your skill keeps you breakeven until you hit your rush of random BS.

    Nothing beats flopping quads while dropping a duece!
  14. #14
    Miffed22001's Avatar
    Join Date
    Jun 2005
    Posts
    10,437
    Location
    Marry Me Cheryl!!!
    Quote Originally Posted by badgers
    Yeah most of what I'm saying is just stuff I've picked up from browsing and worked out, I haven't seen any explanation threads anywhere.

    If the green line is below the others, you are losing a lot of pots that have not gone to showdown, be that through cbets getting raised, bet flop/turn/ river whatever and getting raised/ bet on later streets. I think it's pretty normal to have the green line below the others if you have a high win at showdown % because you will make most of your money in pots that go to showdown.

    I guess if your green line is closer you could be being less aggro when you don't have a hand ie. lower cbet % etc, or you are running goot, or your win showdown % is going down.

    I don't think I've ever seen a good player say that they have a lot of belief that you can get good analysis of your game from these graphs though. Maybe if you couple the graphs with PT stats you can get something, but I think the main use is to see how well you're running and it's debatable that it even shows that...
    makes sense, while i played bad on the sample i had in the grapher, i also knew id run bad and was losing lots at showdown to suckouts etc ad all draws hitting, even with equity adjusted i was -2bbs/100 so i knew i was making errors.
    So much different now that the showdown line is closer and positive to the red/blue but still what i term a significant amount down.
    Meh at least i have a rough idea now!

Posting Permissions

  • You may not post new threads
  • You may not post replies
  • You may not post attachments
  • You may not edit your posts
  •