|
|
 Hand vs. range equity and preflop strategy Hand vs. range equity and preflop strategy
OK, allow me to first warn readers that this isn't really a definitive theory post or anything, just some stuff I've been thinking about, most of which lacks any grand conclusions. I just have nowhere better to put this stuff and I figure this forum needs a breath of new life back into it.
So I was playing with the propokertools simulator. (http://www.propokertools.com/simulations, sorry for the spam but it's necessary for understanding the rest of the post) Most people use this simulator to find PLO equities, but there's an interesting tool that's of interest to Hold'em players, its called "Graph HvR."
This tool takes a given range and hand, and plots how much equity the hand flops vs this range how much percentage of the time.
For example:
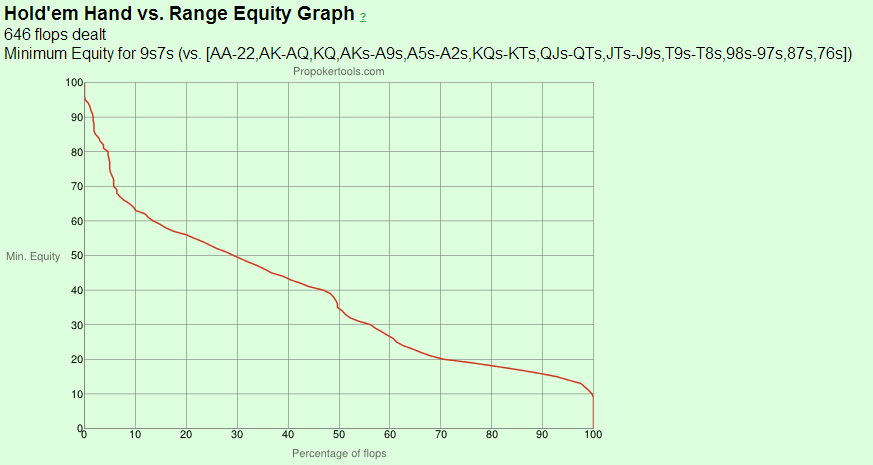
This depicts the spectrum of flop possibilities when you hold 97s vs a 15% UTG opening range.
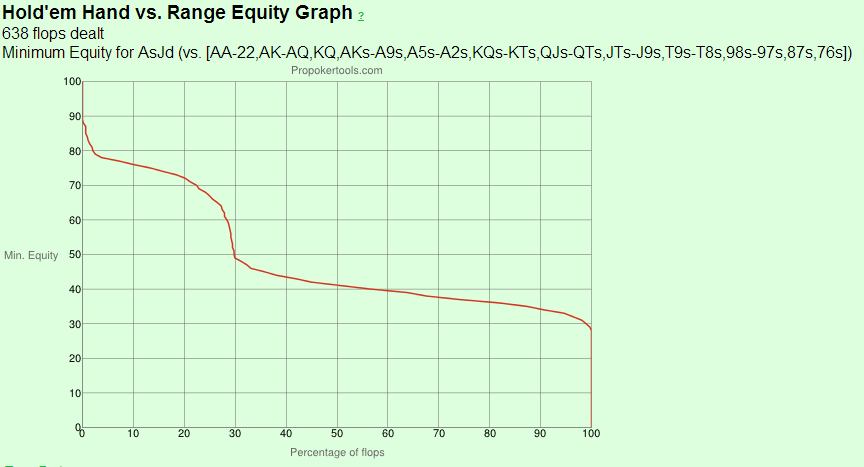
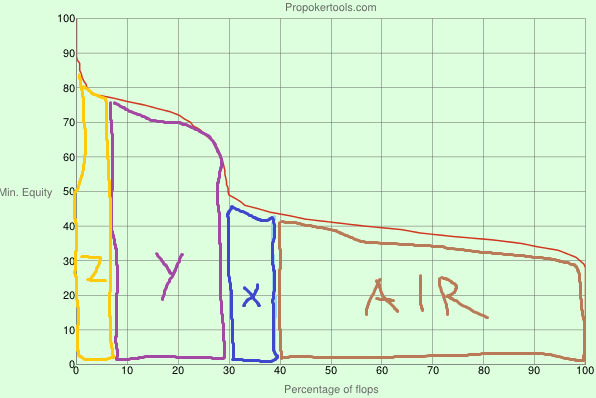
And this is AJ offsuit vs the same range.
After looking at these graphs for a number of different types of starting hands, the following becomes apparent:
- Low card hands like 97 have very reliable feedback as to their equity on the flop. 50% of the time they flop 20 percent equity which is basically garbage. This is intuitively obvious, when you hold 97 on a AJ2 flop you're drawing nearly dead to 2nd pair, you can never make a large mistake folding that hand vs a cbet. Conversely, when you flop AhTs2d with 9s8s, you only have 10% equity vs top pair but you know exactly what turn cards will allow you to improve to beat that hand. This hand actually has value in floating or raising the flop despite the fact that the equity is so low.
- When low cards get boards where they have 30 or more percent equity vs a range, this means that they have a draw of some kind. Draws are valuable beyond the actual equity they have in the pot, as we all know.
- High card hands have very poor feedback on the flop, and have very poor equity distribution. For example, in the depicted AJ hand, 70% of the time it flops a measly 30-40% equity vs the UTG opening range. And where, 30-40% was valuable with 97s, AJ high isn't nearly as floatable vs this range as a flushdraw or oesd would be. This is why we tend to fold AJo to utg opens, despite it being a slight favorite vs a utg opening range.
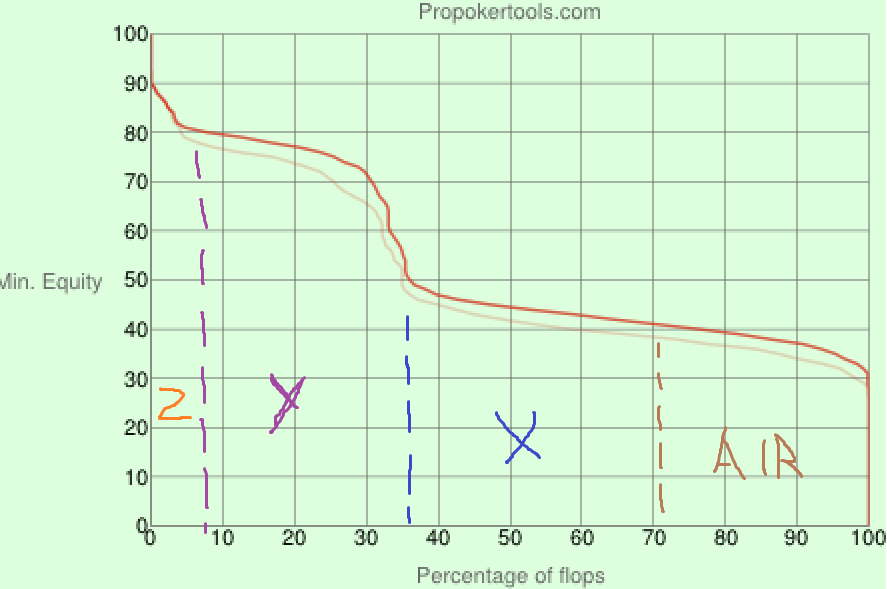
So as I continued looking at these graphs it struck me that the area of these curves has to have some meaning as relates to EV/playability of a hand. So I started doodling on these charts with mspaint. For example:
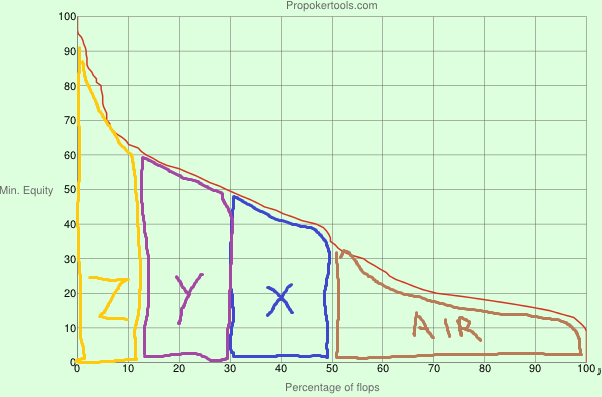
I've VERY roughly defined the categories as air, x, y, and z where:
air - flops where we are very likely to have our equity share in the pot stolen or otherwise having to pay too much to realize it
x - flops where we don't have much but can make some profitable bluffs
y - flops where we make a medium strength hand thats ahead of his range and we attempt to play a small to medium size pot with it and get to showdown
z - flops where we attempt to extract value, above and beyond just trying to realize our equity and win a share of the pot.
The most striking things comparing 97 suited to AJ offsuit that I noticed:
1) AJo distributes its equity in such a way that we are very often forced to fold a significant equity share. We are regularly folding with 30-40% equity which sucks. 97's air has 20% equity at best so we don't lose as much equity when we miss and have to fold.
2) That said, AJo has significantly more equity to distribute to begin with. Theoretically there should be a point where raw equity wins over. AQo vs a utg range would be an example of this (nevermind the fact that AQ high is often strong enough to call the flop anyway, even if it weren't, pair value gets us past the point of +ev in most cases).
3) AJo has fewer opportunities to effectively semibluff when it misses. This should be obvious to most, but it is seen very clearly in the fact that the "X" slice of its range is tiny when compared with 97s.
Anyway, that's where I am now. I'm thinking that there should be a way to directly valuate the area under the curve. Obviously the area under the part where we have over 80% equity should be worth significantly more than the area under 60%. I'm wondering if we can just count the squares under the line and attach a value to each square, add up the values and result in an accurate estimate of the value of a hand vs a range, compare this value with the amount to call preflop (whether this be coldcalling an open, flatting a 3-bet, or flatting a 4-bet), and decide whether to play the hand or not.
What do you guys think?
|


 Reply With Quote